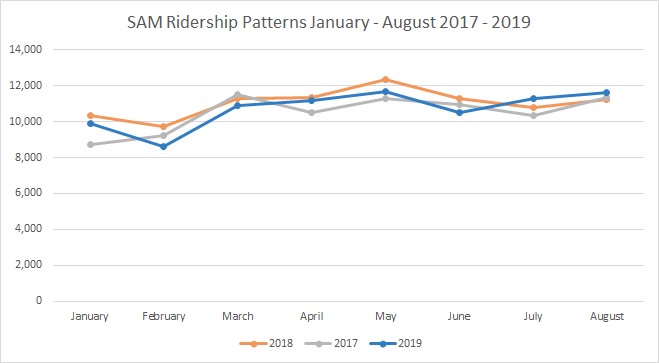
SAM services provided 11,627 rides in total, an overall increase of 3.6% compared to August 2018. SAM Gresham provided 8,593 of those rides as compared to 8,601 in 2018.
SAM Estacada experienced an 71.5% increase. The Shopper Shuttle experienced a 67.4% increase with 1,047 rides. STAR experienced an 24.8% decrease, likely due to riders choosing the Shopper Shuttle. ED had a decrease of 54%.
Sandy staff represent rural transit on the board of the Special Transportation Fund Advisory Committee (STF). Staff participated in several meetings regarding updates to the Coordinated Transportation Plan for the Elderly and Persons with Disabilities. These efforts, and other via subcommittee continue.
HB 2017 funds were received in July and the first round of reporting to the Oregon Department of Transportation was due in August. These funds have funded added service to the SAM Gresham, SAM Estacada and Sandy Shopper routes since January. Technical and Infrastructure improvements, such as new computers and monitors and new bus stop signs have been implemented as well.
The second round of meetings with Sandy stakeholders for the Transit Master Plan are scheduled for September.
