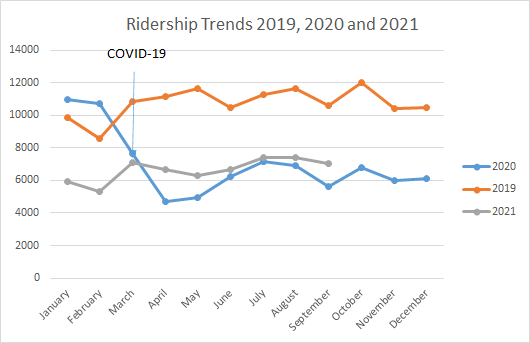
In September SAM carried 7,054 passengers. Ridership increased 25.2% over September 2020 and is 33% lower than pre-COVID levels. As shown in the ridership chart, September is typically a low ridership month. This September SAM did not experience a significant drop however.
SAM’s new Ford Transit Vans are on the road and receiving great feedback from drivers and passengers alike. SAM has one more Ford Transit Van on order, using CARES ACT funds.


SAM staff conducted on board surveys of both SAM and MHX services in September. Survey collection has been different since COVID. Previously, SAM staff rode all services on various days, which also required the use of drivers and volunteers, to collect surveys in person. Since COVID, SAM has collected survey data onboard by leaving surveys on the buses and the drivers inform passengers to fill them out if they’d like AND surveys are conducted online. While these methods do not elicit the same response rate as an on board surveyor, it does still collect some necessary information.
Of those surveyed on board, 62% began their trip in Sandy with 61% choosing Sandy as their destination. Approximately 59% will use 1 bus for their trip while 35% will use 2-3 and 5% will use 4 or more buses or trains to get to their final destination. 42% use transit almost daily with another 32% use the bus 3-4 times weekly, ultimately 74% use the bus at least 3-4 times weekly. Over half (at 53%) use the bus to commute. Shopping/running errands is the next most common purpose (24%). As illustrated in the chart, the 45 to over 60 population are the highest demographic.

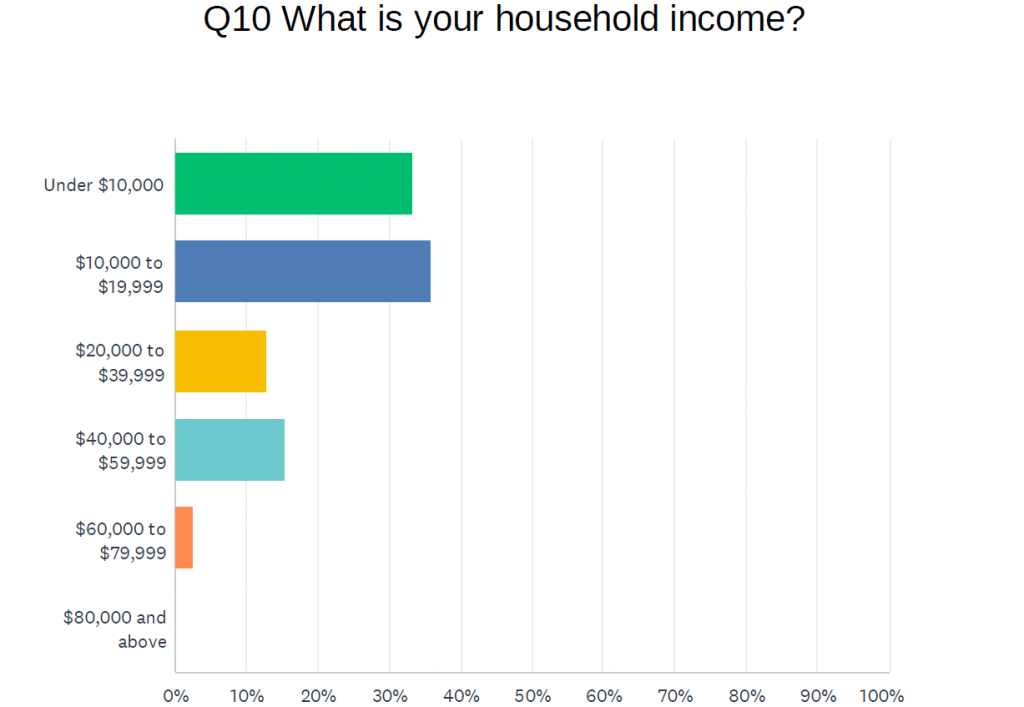
Of those surveyed on board, 69% earn under $19,999 per year and 82% earn less than $39,999 per year.
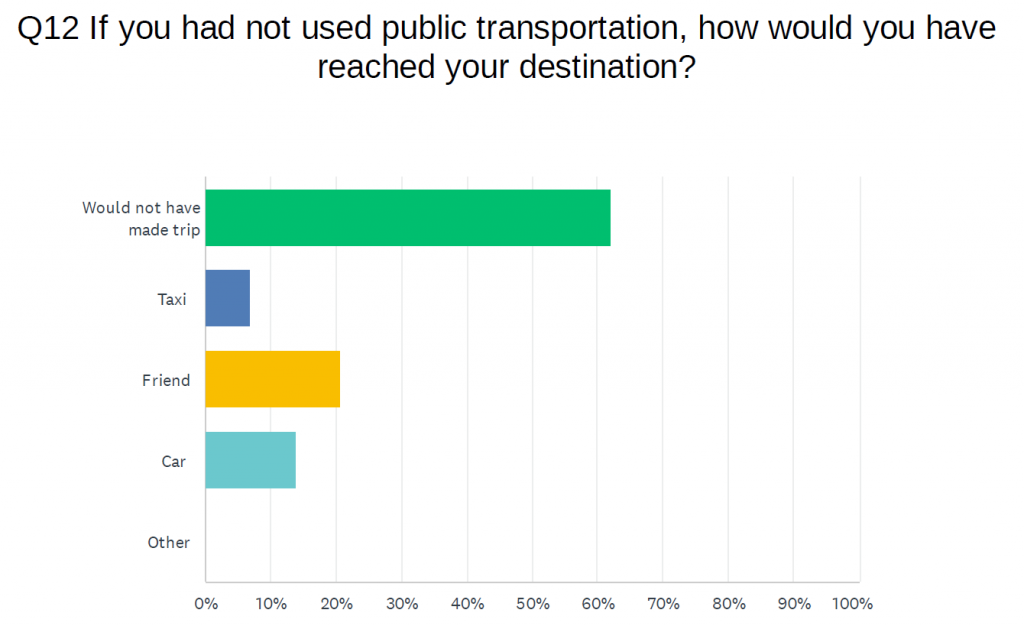
Finally, of those who responded, 62% would not have been able to make the trip if public transit were not available.
In summary, SAM’s passengers are heavily transit dependent. They tend to be older, female (chart not shown, 54% female), with lower earnings and no other way to make their commute trip, shopping or errands if public transit were not available. They generally believe the service is very good (highest option) or Satisfactory (next highest) as 97.5% answered as such for buses on time 82% for convenient schedules and 94% for easy to read schedules. Where SAM needs improvement seems to be on the website and the mobile. For the website, 76% answered very good or satisfactory and the mobile app received the lowest very good/satisfactory ratings at 63%.
The most requested improvement to the service was more frequent service with 57% responding very important and 26% somewhat important (83%). More Sunday service was the next most requested improvement with 78% responding very important or somewhat important.
The following are comments from the September survey, there were zero negative comments:
Love SAM bus just wish there were more rides on weekends!
Love SAM. They’re really reliable and the drivers are kind.
I have been using public transit for many years and the Sandy Transit is by far the best I have ever used.
I know most of the drivers from riding and the operators that do the scheduling. These are hard working people. I have also found that if I am time and everyone could be, their day would run smooth. I would like to thank each and every one for their service. I have trouble with my balance and I am helped often getting on and off with my walker and groceries. They become friends. Thank you people.
Super grateful for the servie you (SAM) provide. Sincerly!